

custom-migrator domain was triggered too early. This is usually an indicator for some code in the plugin or theme running too early. Translations should be loaded at the init action or later. Please see Debugging in WordPress for more information. (This message was added in version 6.7.0.) in /srv/www/wordpress/wp-includes/functions.php on line 6131all-in-one-wp-migration domain was triggered too early. This is usually an indicator for some code in the plugin or theme running too early. Translations should be loaded at the init action or later. Please see Debugging in WordPress for more information. (This message was added in version 6.7.0.) in /srv/www/wordpress/wp-includes/functions.php on line 6131Fast & Cost-Effective APM with AI-based sampling. Runs On-Prem with no traces data sent out of your cloud.
Easy log management with fast search & data privacy at the core. No log data leaves your cloud. Ever.
Track hosts, databases, containers, and cloud services in real time — with unlimited retention and full data control.
Track every user journey in real time. Get instant visibility into performance bottlenecks with 4X faster, on-prem RUM.
Prevent downtime before it happens with proactive, scripted tests. Simulate user journeys and detect issues before customers are impacted.
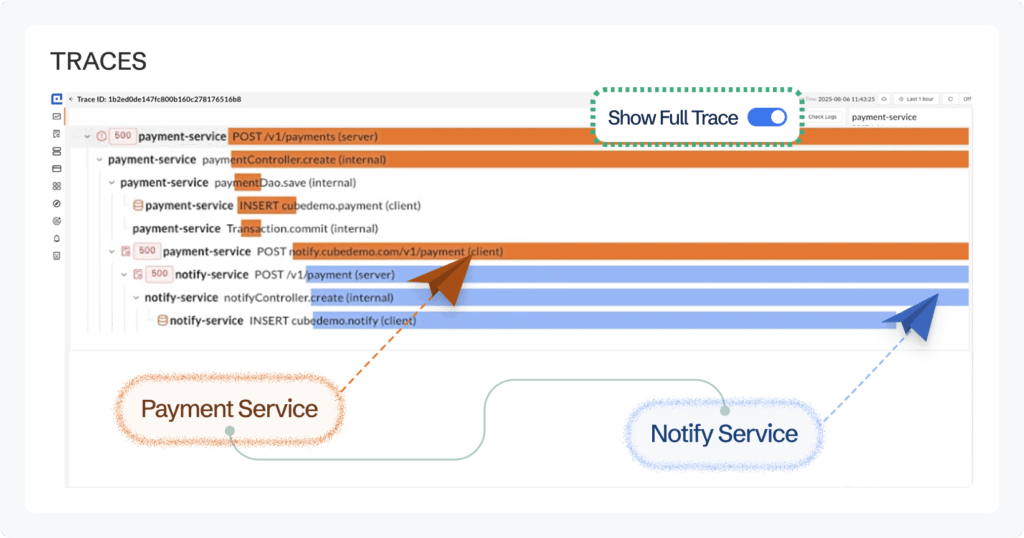
Fast & Cost-Effective APM with AI-based sampling. Runs On-Prem with no traces data sent out of your cloud.
Fast & Cost-Effective APM with AI-based sampling. Runs On-Prem with no traces data sent out of your cloud.
Easy log management with fast search & data privacy at the core. No log data leaves your cloud. Ever.
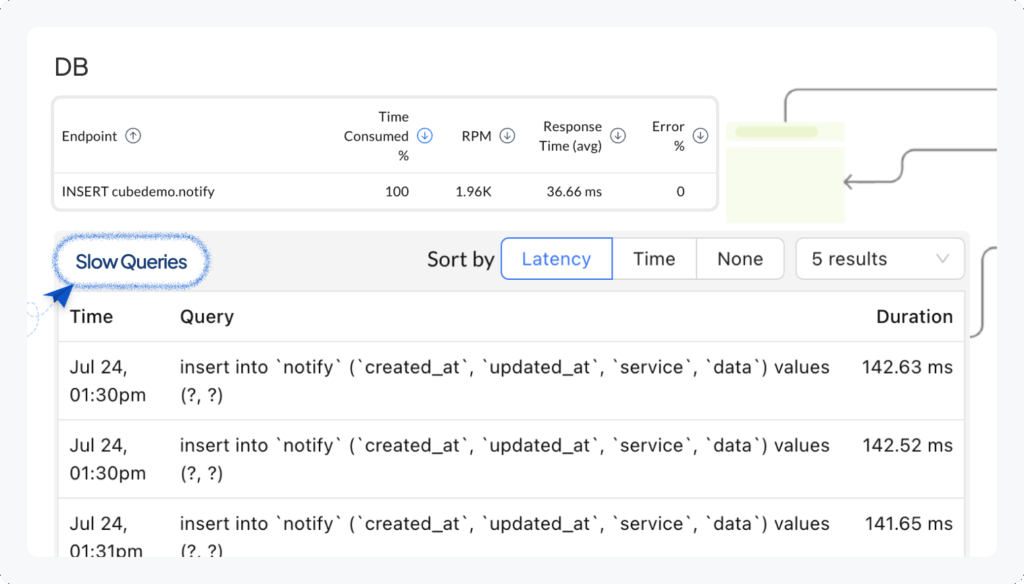
Track hosts, databases, containers, and cloud services in real time — with unlimited retention and full data control.
Track every user journey in real time. Get instant visibility into performance bottlenecks with 4X faster, on-prem RUM.
Prevent downtime before it happens with proactive, scripted tests. Simulate user journeys and detect issues before customers are impacted.
Fast & Cost-Effective APM with AI-based sampling. Runs On-Prem with no traces data sent out of your cloud.