CubeAPM
CubeAPM CubeAPM

Infrastructure Monitoring

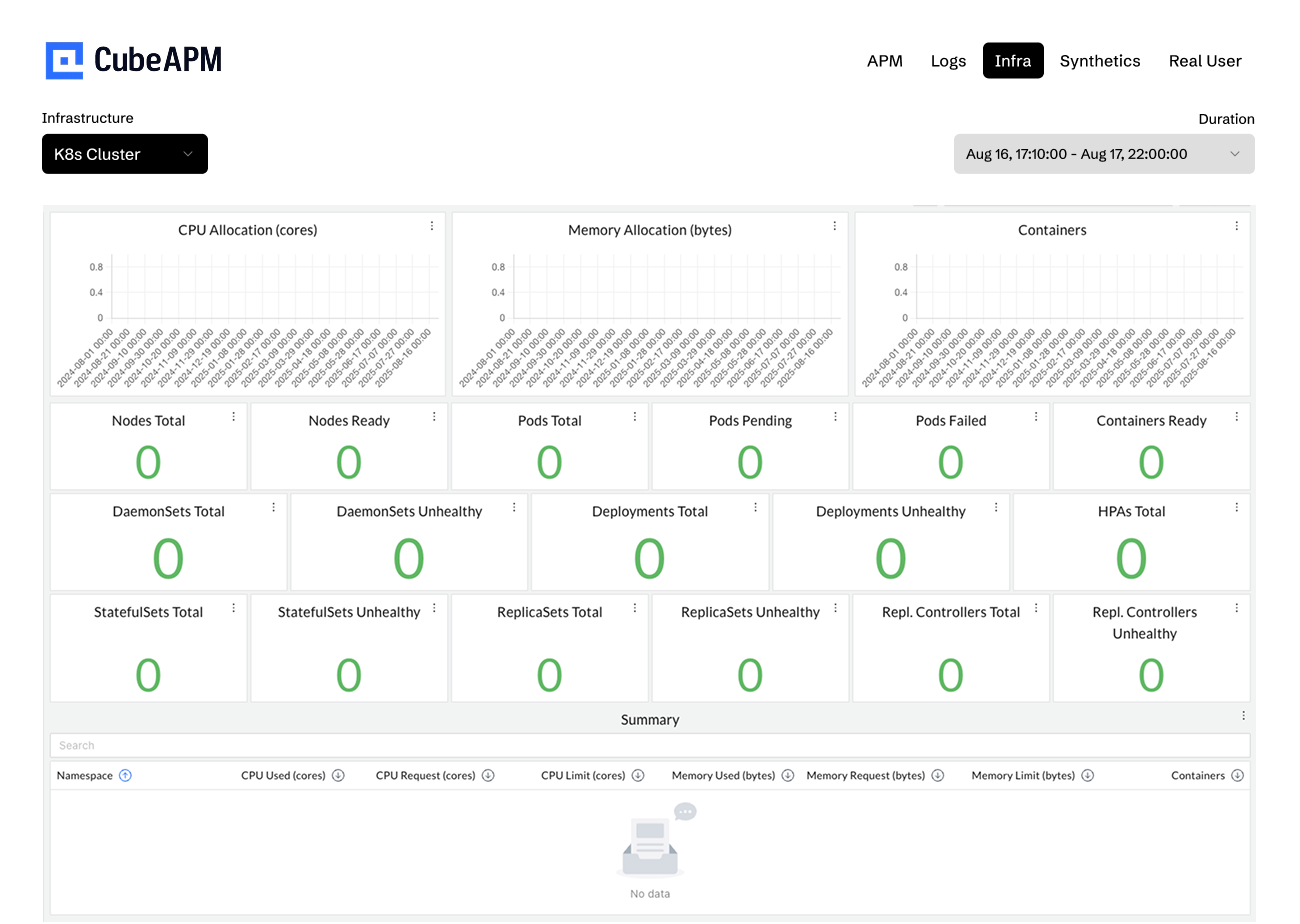
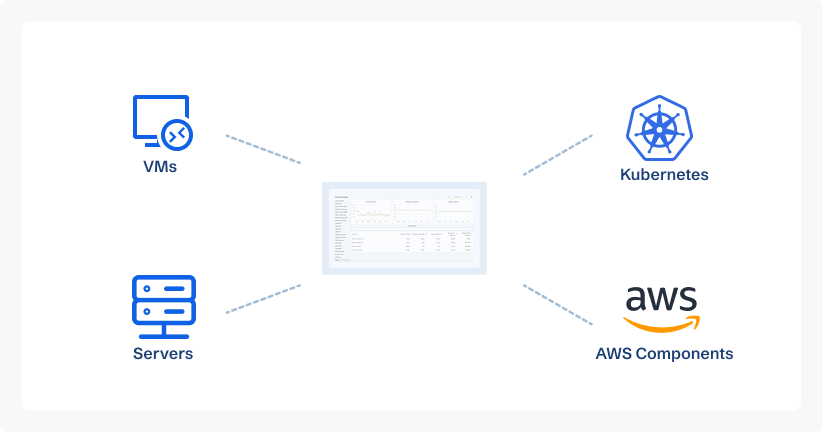
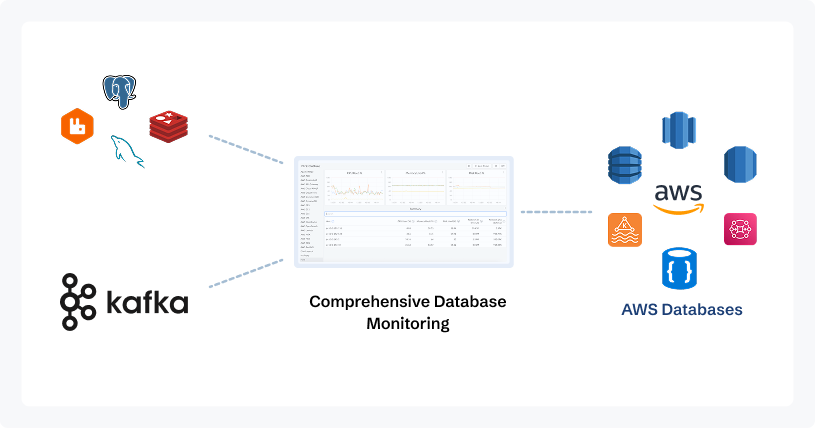
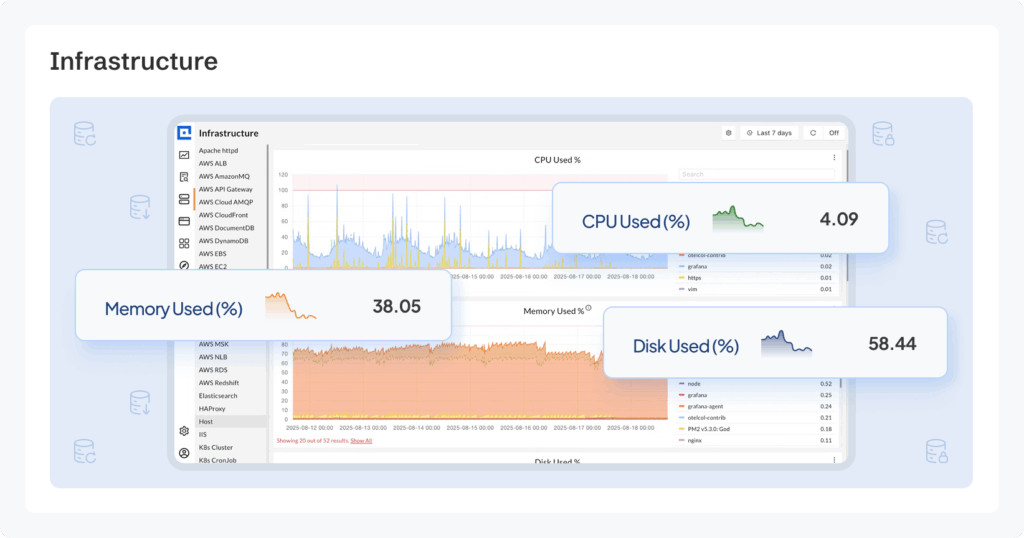
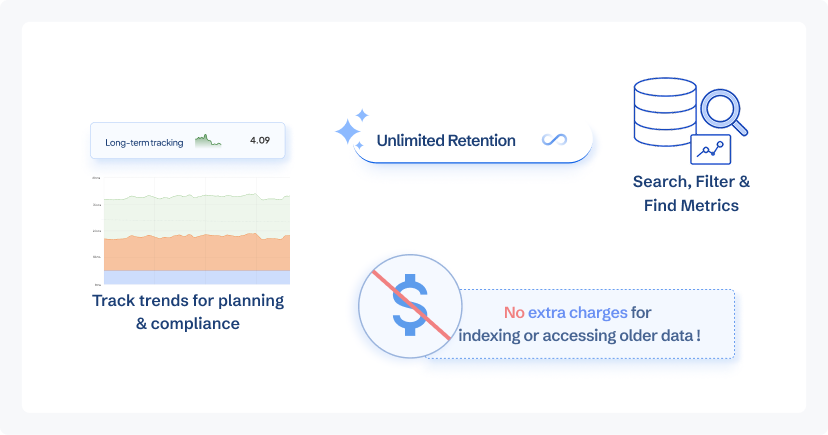
Track hosts, databases, containers, and cloud services in real time — with unlimited retention and full data control.

Why choose CubeAPM?

Your data is fully compliant and secure with CubeAPM

Your Entire Infrastructure, Monitored in One View

Eliminate silos and manage all infrastructure performance data in one connected platform.

Seamless Correlation

Link infrastructure metrics with APM traces and logs to pinpoint root causes faster.

Real-Time Anomaly Detection

Spot unusual patterns in resource usage before they turn into outages.

Multi-Cloud & Hybrid Ready

Monitor infrastructure across AWS, Azure, GCP, on-prem, and hybrid setups from one UI.

No-Code Dashboards

Create and customize dashboards instantly — no queries, scripts, or engineering bottlenecks.

All around Infra Monitoring

Host Monitoring Across All Environments

Gain deep visibility into VMs, containers, serverless workloads, and cloud infrastructure.

Delhivery improved Kubernetes incident resolution time by 45% after implementing CubeAPM’s pod- and node-level monitoring.

Comprehensive Database Monitoring

Track the health and performance of all database types from one platform.

Practo reduced database latency by 35% after using CubeAPM to pinpoint slow queries in PostgreSQL and Redis.

Monitor All Key Metrics

Stay on top of infrastructure, Kubernetes, and database performance indicators.

Mamaearth prevented a production outage by detecting abnormal CPU spikes early with CubeAPM’s indexed metric search.

Intelligent Alerting

Proactively address infrastructure issues before they impact performance.

Policybazaar cut alert noise by 50% by using CubeAPM’s anomaly detection and contextual alerting.

Unlimited Retention Without Limits

Store and access infrastructure metrics for as long as you need, without extra fees.

Redbus scaled to 15TB+ monthly metric ingestion without any performance degradation or added cost using CubeAPM’s flat retention model.

Try our standard plan for 50% off!

Unlimited Log Retention
Usage based Pricing
Real-Time Dashboards
OTel Compatible

$0.15

/GB

Usage based pricing applicable

800+ Integrations to Monitor Your Entire Stack With No Extra Costs

800+ integrations include Slack, Jira, email, webhooks, alerting tools, CI/CD platforms, and observability stacks—fully plug-and-play and OpenTelemetry-ready.


“ Working with CubeAPM feels like a partnership; as we continued to use their tool and found more use cases. ”

Client Wins #1
Some description about the metrics CubeAPM helped monitor in this company.
Metric #2
Some description about how CubeAPM helped this client in their success.

Client Name

Position - Company

Powering 1B+ requests/month across India’s top platforms.

Instant insight into application performance, rapid issue resolution, and major cost savings. CubeAPM delivers full performance observability that outpaces the competition at a fraction of the cost.

Zero Vendor Lock-In & Opentelemetry compatible

CubeAPM is the only APM platform built natively on OpenTelemetry—giving you unmatched flexibility, 100% trace fidelity, and no vendor lock-in. Your observability, your way.

Frequently asked Questions

How does CubeAPM’s infrastructure monitoring work?
CubeAPM collects metrics from VMs, containers, Kubernetes clusters, databases, and cloud services. It indexes all metrics by default, allows real-time correlation with traces and logs, and provides dashboards and alerts without any retention-based limitations.
Can I monitor multi-cloud or hybrid environments with CubeAPM?
Yes. CubeAPM supports AWS, Azure, GCP, and on-premise deployments. You can monitor all environments from one dashboard without switching tools or maintaining separate setups.
How is CubeAPM different from other infrastructure monitoring tools?
Unlike many tools that charge extra for indexing or long-term storage, CubeAPM includes unlimited metric retention in its pricing. It also offers on-prem or VPC deployment for full data residency and integrates natively with Kubernetes, databases, and cloud services.
What metrics should I monitor for infrastructure performance?
Key metrics include CPU usage, memory utilization, disk I/O, network latency, error rates, and service availability. For Kubernetes, node and pod health, and for databases, query performance and replication lag are also essential.
Who needs infrastructure monitoring?
Infrastructure monitoring is essential for DevOps teams, SREs, and IT operations in any organization that relies on servers, containers, databases, or cloud services. It helps maintain uptime, optimize resources, and ensure smooth application performance.